Signal Bot MACD Cross — fast detection of MACD crossovers with the signal line
Classic entry based on the crossover of MACD and the signal line. A breakdown of the idea, the indicator’s origin, the bot’s logic, parameter impact, presets for OTC/real market, and a trading plan.
Contents
What is MACD Cross
MACD Cross is an entry approach based on the crossover of the MACD line and the signal line.
MACD (Moving Average Convergence/Divergence) was developed by Gerald Appel. The MACD line is the difference between EMA (fast) and EMA (slow); the signal line is a smoothed EMA of the MACD itself.
The idea: when MACD crosses the signal line from below upward, the impulse accelerates bullishly; when it crosses from above downward — bearishly.
- MACD line = EMA(fast) − EMA(slow)
- Signal line = EMA of MACD
- Histogram = MACD − signal (not used directly in this bot)
How our bot works
- Calculates MACD by the fast/slow/signal parameters.
- Tracks the fact of crossover:
- BUY — MACD is above the signal line after having been below it on the previous bar.
- SELL — MACD is below the signal line after having been above it on the previous bar.
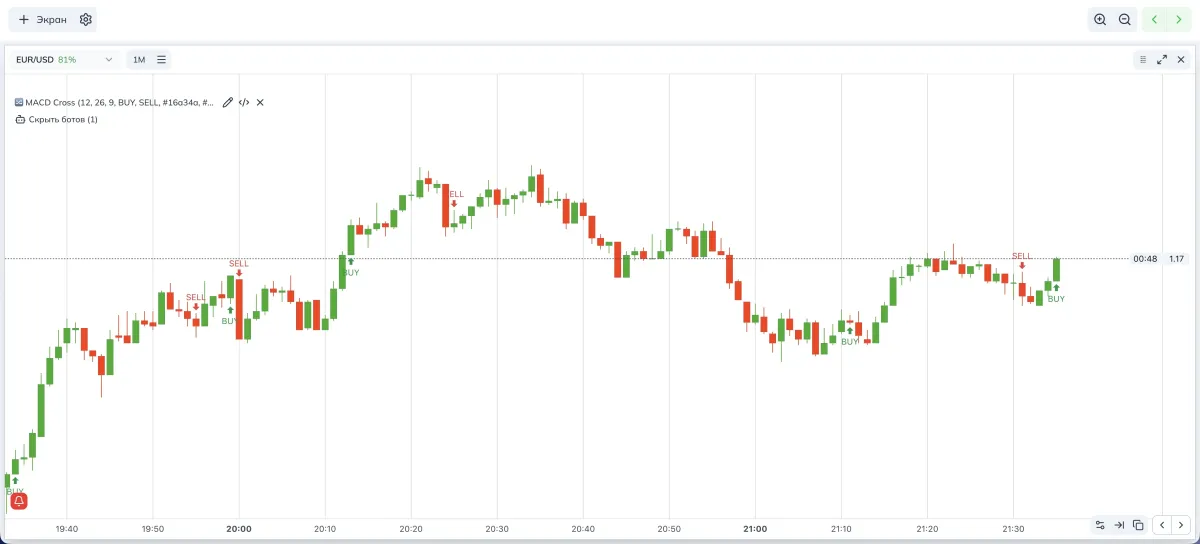
- Places a BUY/SELL marker on the crossover bar (an arrow and text are shown on the chart).
Learn for free
Parameters and impact
| Parameter (as in settings) | What it means | If you decrease | If you increase |
|---|---|---|---|
| MACD fast | Period of the fast EMA | More sensitive, more crossovers | Smoother, fewer crossovers |
| MACD slow | Period of the slow EMA | More sensitive, more noisy crossovers | Smoother, less noise |
| MACD signal | EMA smoothing of the MACD line | Signal comes faster, earlier, but noisier | Signal comes later, cleaner, but later |
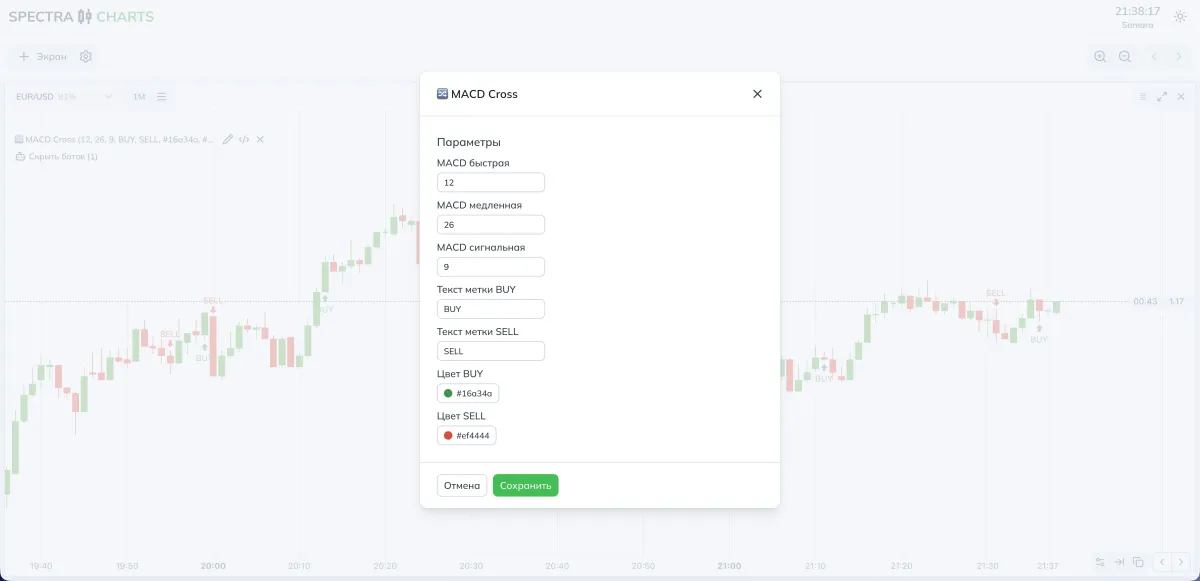
| BUY/SELL label text | Captions for arrows | — | — |
| BUY/SELL color | Color of arrows and text | — | — |
- More signals: reduce the fast and signal; if needed, slightly lower the slow.
- Fewer but clearer: increase the slow and/or signal; keep the fast moderate.
Modes and presets
- MACD: 12 / 26 / 9
- Character: more reactive, more crossovers
- If there are too many crossovers: raise the signal (e.g., to 11–12) or increase the slow to 28–30
- MACD: 12 / 26 / 9 (base)
- To filter noise: increase the signal to 10–12 or the slow to 28–30
- In a sustained trend: you can keep the base and control frequency via the timeframe
Combinations and practical notes
- Timeframe controls pace: lower TF — more crossovers, more noise; higher TF — fewer, more stable.
- Trend backdrop: if you want to trade only with the trend, you may externally restrict trades (e.g., take BUYs when price is above a chosen EMA).
- News window: during volatility spikes, it’s better to switch to a stricter signal.
Where to view signals in Spectra Charts
Open the asset on Pocket Option in Spectra Charts.
Connect the MACD Cross bot.
Check the timeframe; start with 1 minute.
Watch the BUY/SELL arrows at crossover points.
Trading plan
BUY
On the bar where MACD crossed the signal from below upward; plan the entry on the next candle.
SELL
On the bar where MACD crossed the signal from above downward; entry — on the next candle.
Expiration
1 candle; later test 2–3 candles based on your own stats.
Risk
Fixed trade size; no martingale during the tuning phase.
FAQ
Increase the signal and/or slow; if necessary, raise the timeframe.
Lower the signal; carefully reduce the slow to speed up the reaction.
2–3 currency pairs with stable payouts; don’t spread yourself across a large list.
Summary
MACD Cross relies on a straightforward trigger — the crossover of MACD and the signal line. Frequency and quality are adjusted by three periods: fast, slow, signal. Tune them to your needs, changing one parameter at a time and recording the result.