Trading Bot Streak Hunter — entry against a streak of same-colored candles
Searching for streaks of candles of one color and a counter-trend entry at the “inflection.” Bot logic, parameter impact, recommendations for OTC and the real market, and a trading plan.
Contents
What is Streak Hunter
Streak Hunter detects streaks of consecutive candles of the same color and gives a counter-trend signal when the streak reaches a specified length. The idea is simple but useful when the market makes short “imbalances” and then returns to the mean.
- a sequence where closes move in the same direction.
- A green streak is several candles in a row closing above the open.
- A red streak is several candles in a row closing below the open.
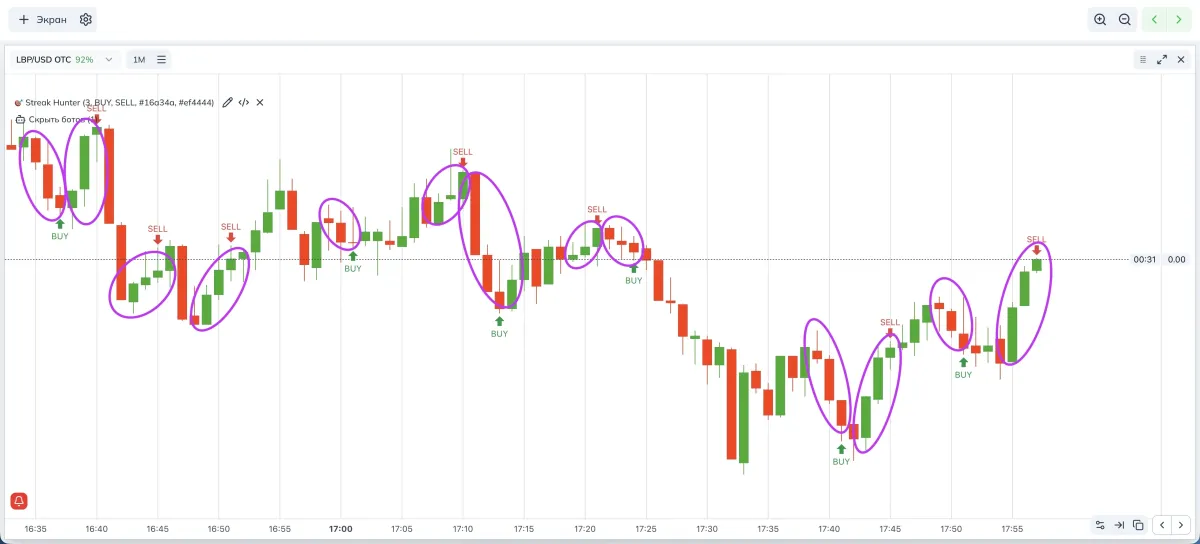
How our bot works
- Calculates the current length of green and red streaks.
- When the length reaches Minimum consecutive candles, the bot places a counter-signal:
- after a green streak — SELL,
- after a red streak — BUY.
- The marker appears on the current bar, the entry is planned on the next candle.
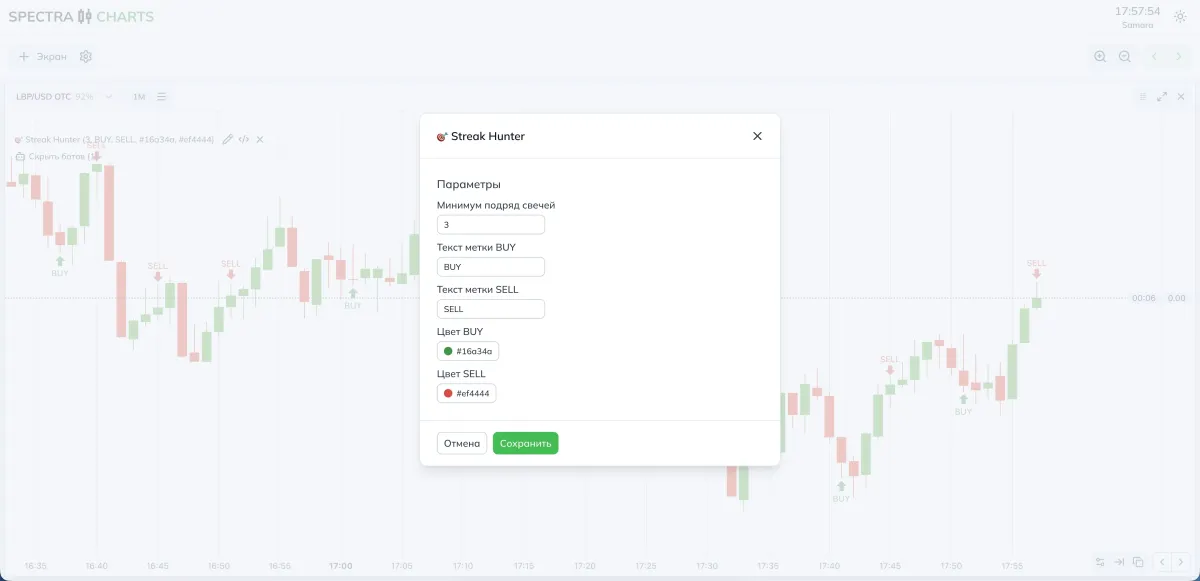
Parameters and impact
| Parameter (as in settings) | What it means | If you decrease | If you increase |
|---|---|---|---|
| Minimum consecutive candles | Required streak length for a signal | More signals, more aggressive entries | Fewer signals, more cautious entries |
| BUY/SELL label text | Captions for arrows on the chart | — | — |
| BUY/SELL color | Color of arrows and label text | — | — |
Learn for free
Parameter recommendations
Modes and presets
- Minimum consecutive candles: 3
- Idea: streaks occur more often on OTC, so a length of 3 gives a balance of frequency and adequacy
- If there are too many signals: raise the streak length to 4
- Minimum consecutive candles: 3–4
- Idea: there are “imbalances” on news; a stricter threshold reduces false entries
- If there are few signals: temporarily lower to 3, but monitor news release times
Combinations and tips
- Timeframe controls pace
On lower TFs there are more and shorter streaks; on higher TFs they are rarer and more stable - Time filter
Avoid the minutes around sharp news releases; streaks there can be “unstable” - “More cautious” mode
Increase Minimum consecutive candles to 4 when the market is “choppy” and there are many false pullbacks
Where to view signals in Spectra Charts
Open an asset on Pocket Option in Spectra Charts
Connect the Streak Hunter bot
Choose a timeframe, start with 1 minute
Watch for BUY and SELL markers where streaks end
Trading plan
BUY
After a red streak with a length no less than the threshold, a BUY marker is placed
The entry is planned on the next candle
SELL
After a green streak with a length no less than the threshold, a SELL marker is placed
The entry is planned on the next candle
Expiration
One candle; it may be possible to use 1–2 re-entries on this asset
Risk
Fixed trade size; no re-entries during the tuning phase
FAQ
Lower Minimum consecutive candles to 3 on the real market or test a lower timeframe
Increase Minimum consecutive candles to 4 and avoid the minutes around news
Two or three currency pairs with stable payouts; don’t spread yourself across a large list
Summary
Streak Hunter catches moments when a series of one-direction candles overheats and makes a counter-entry. The main frequency control is Minimum consecutive candles. Change it “one step at a time,” record the result, and choose your balance between the number and accuracy of entries.