Indicators
How popular indicators and oscillators work, their settings, and how to combine them in trading strategies on Pocket Option.
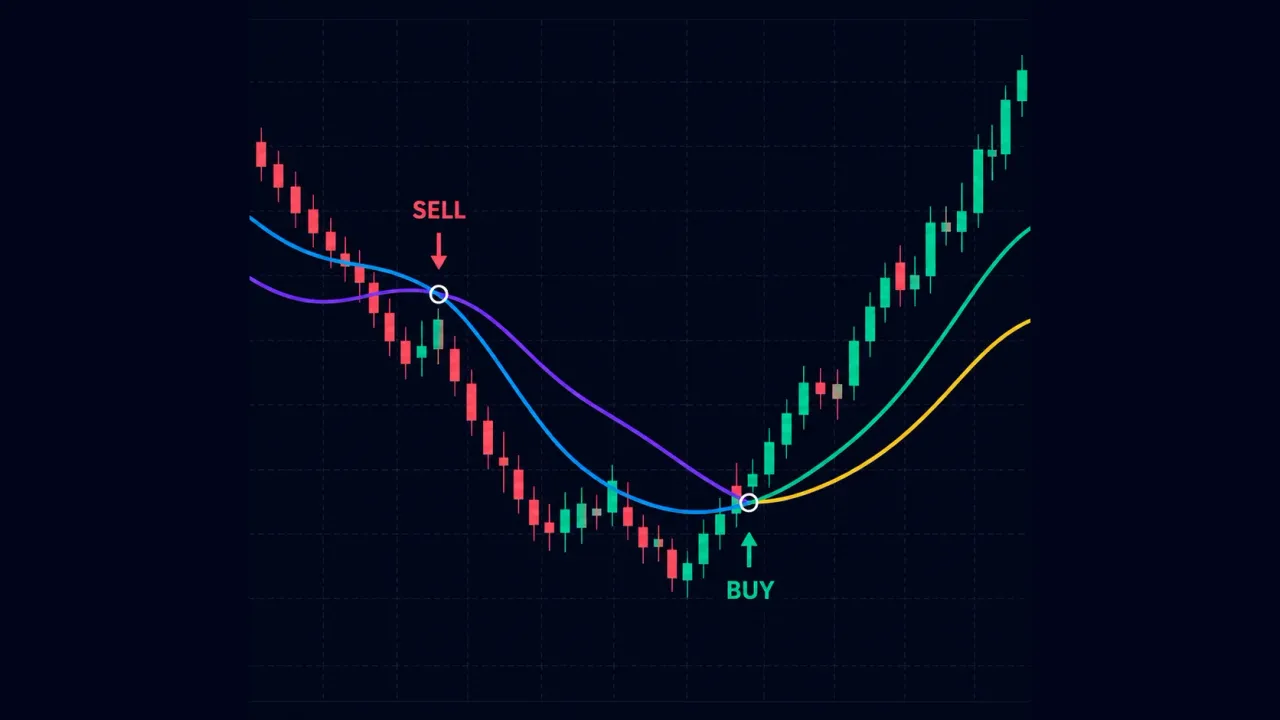
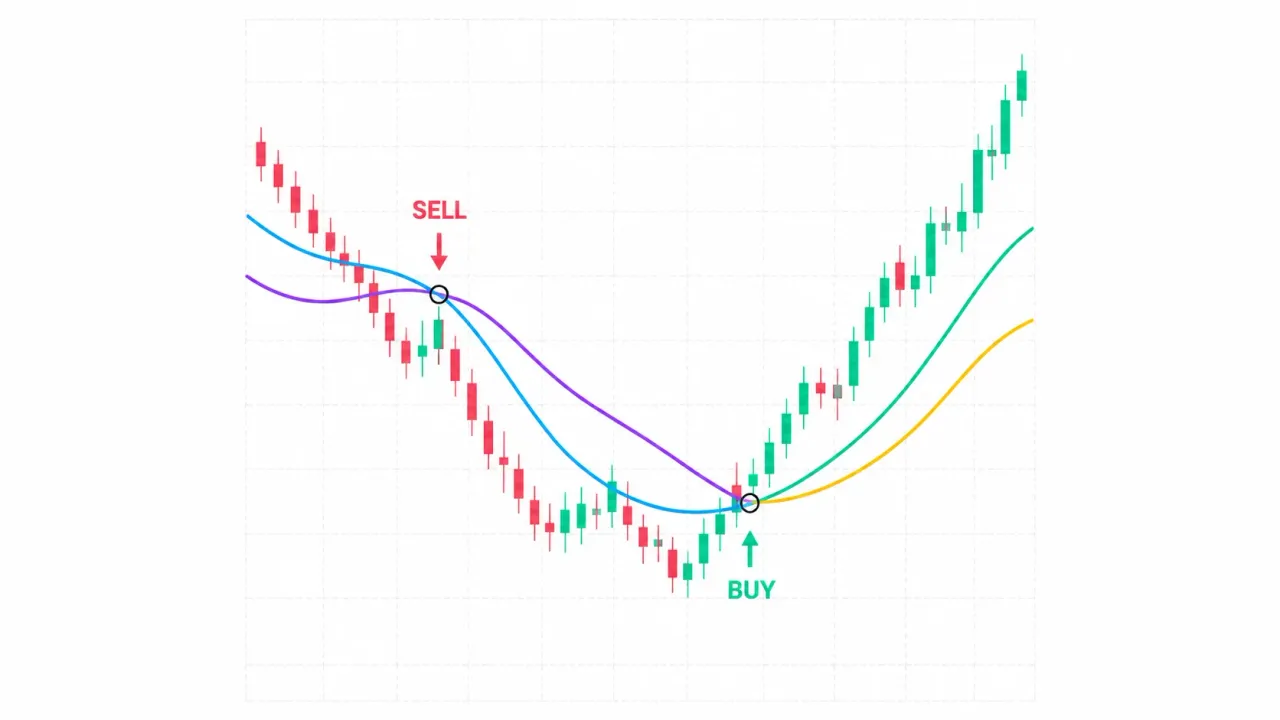
Indicator Trend Signals — moving average crossovers for a quick view of the current trend
Two EMAs combine into a trend indicator with intuitive line recoloring only when crossed by price, and also place handy visual BUY/SELL signals via the indicator’s built-in algorithms.
Read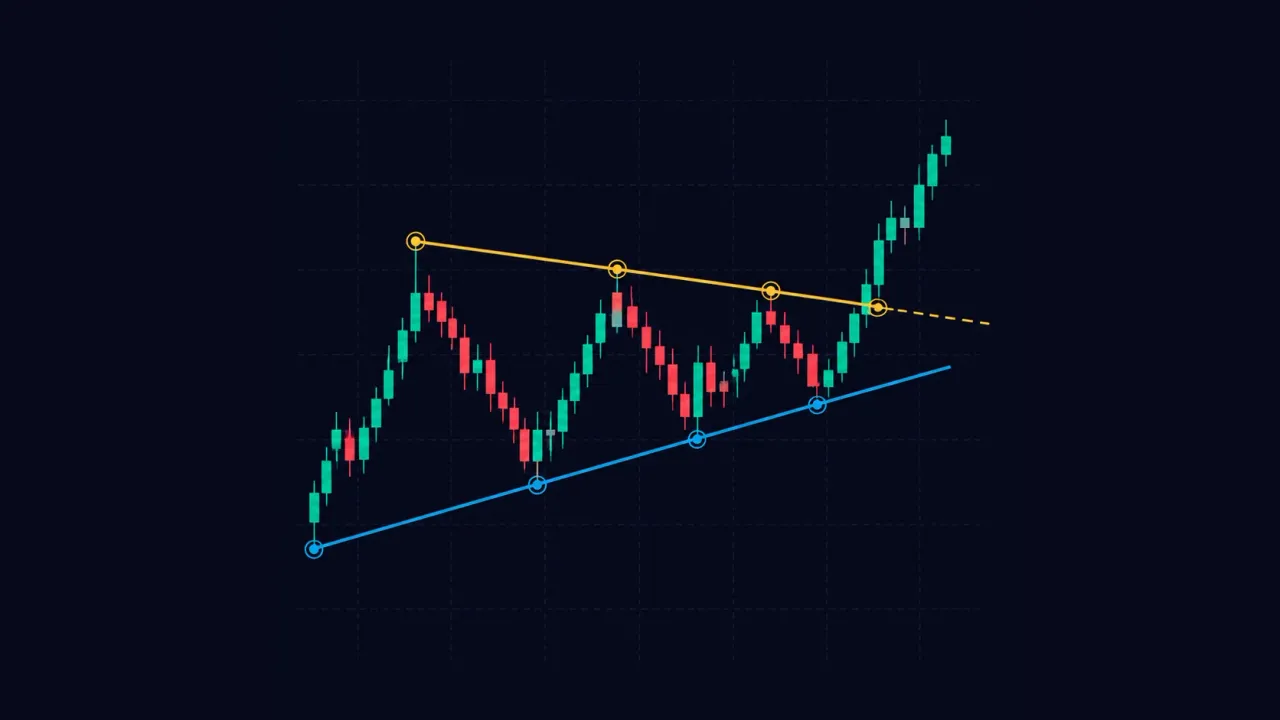
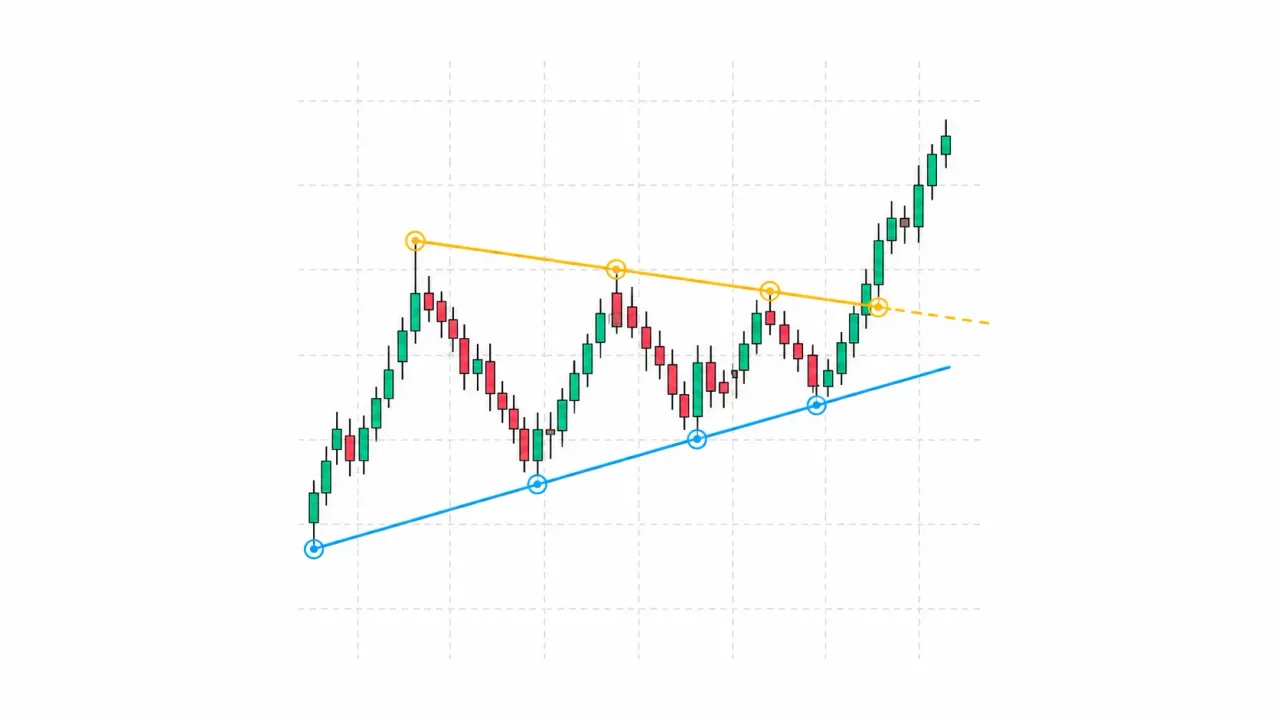
Sloped Levels Indicator — automatic construction
Draws sloped support and resistance from fresh pivots, supports simple and “strong” lines, extends them to the current price, and marks breakouts with a dashed style
Read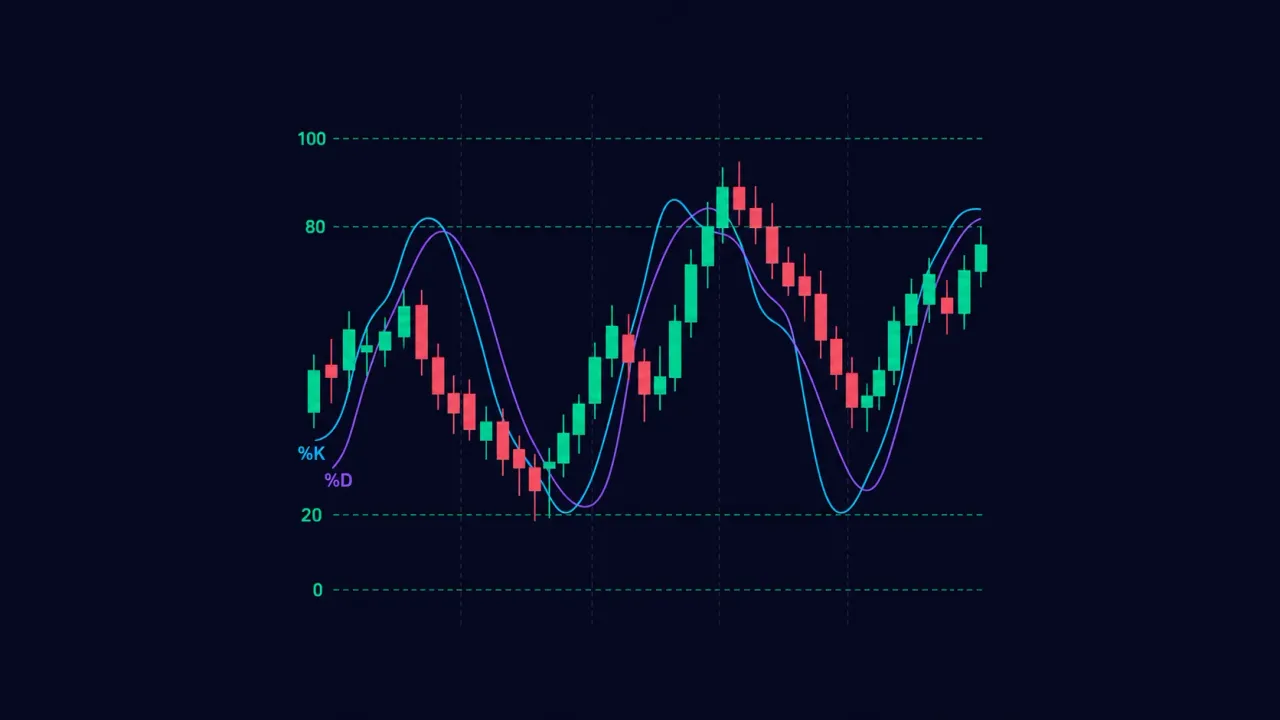
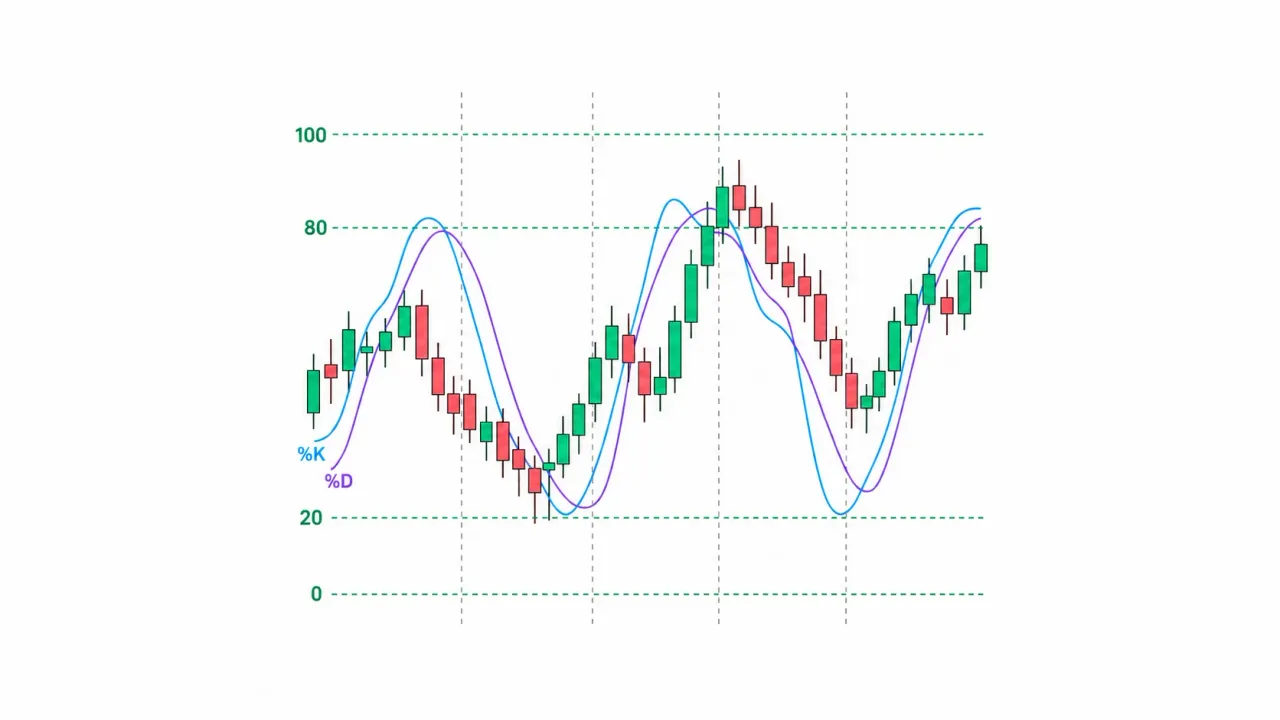
Stoch Levels Overlay — classic stochastic oscillator over the chart
Overlays stochastic 0/20/80/100 levels directly on candles: soft overbought/oversold zones, guide lines, and an optional %K/%D projection. Convenient for catching reversals at channel edges and disciplining entries with Spectra Charts.
Read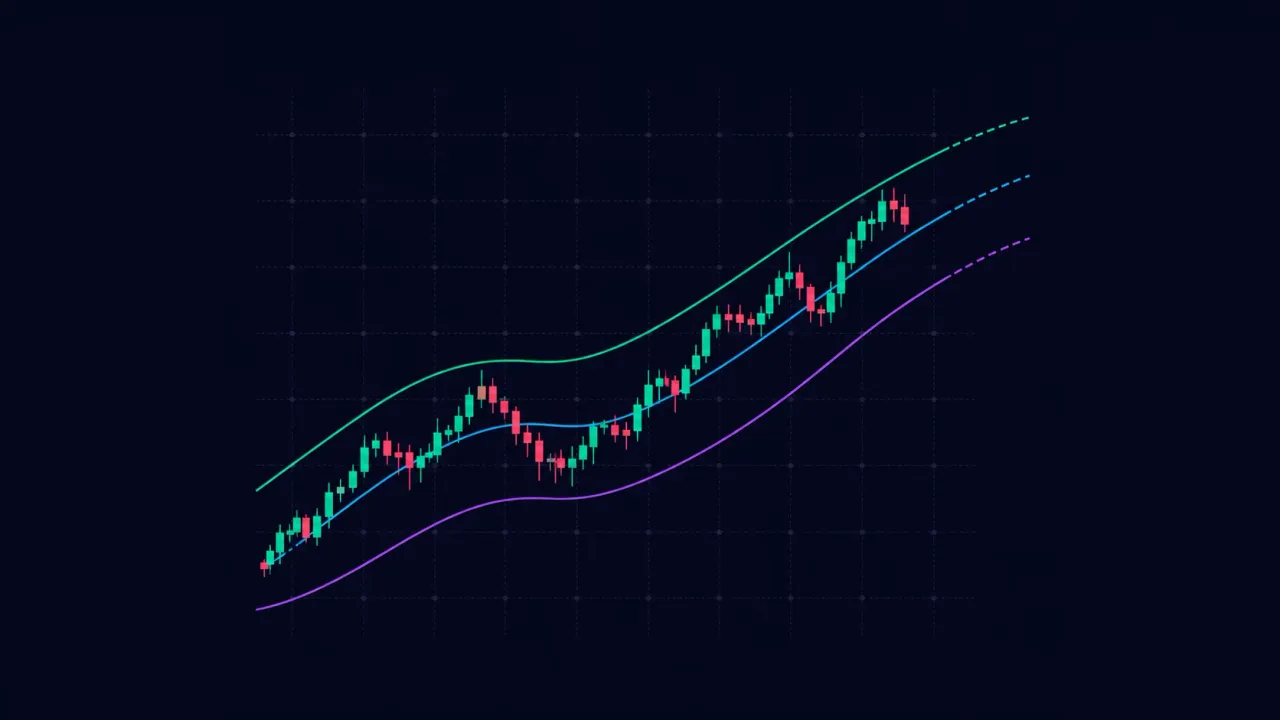
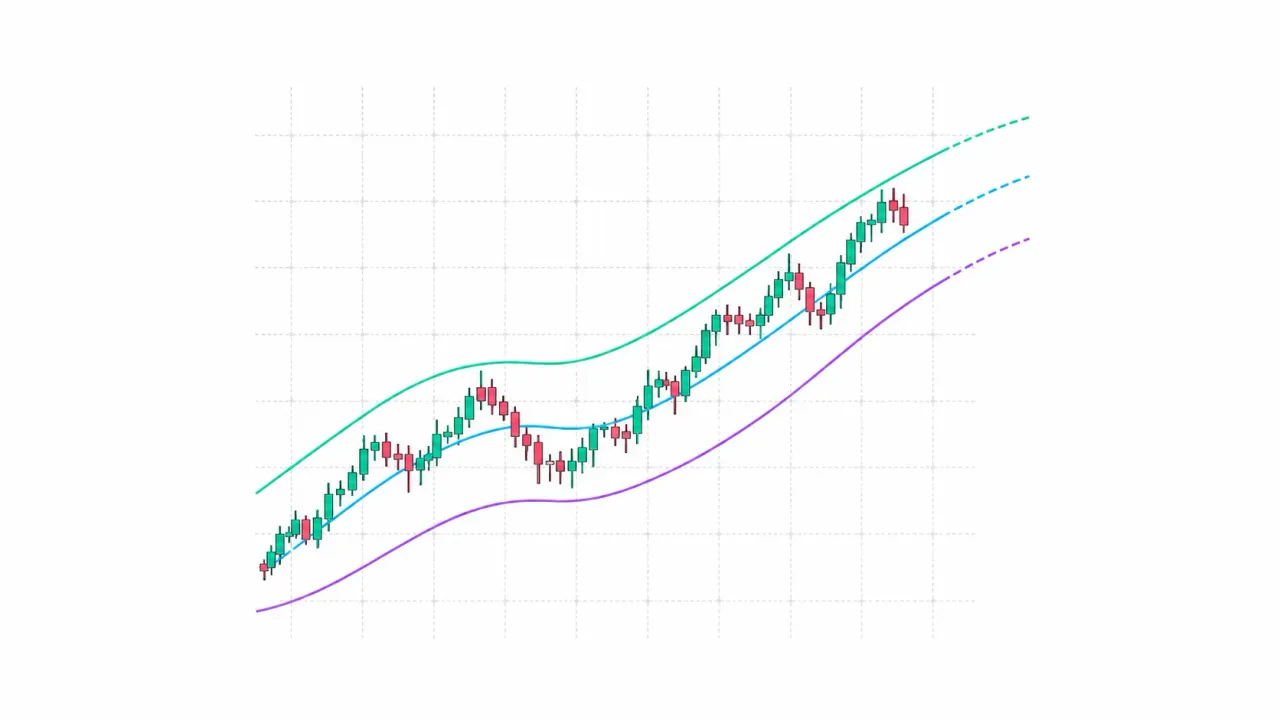
Adaptive Regression Channel — an adaptive regression channel with a neat forecast
A flexible price channel on polynomial regression that adapts the window to volatility, keeps edges based on standard deviation, and softly extends ranges forward via a short Fourier forecast. The center recolors only on an actual price crossover — no chatter. A great tool for catching channel touches, inflections, and breakouts from consolidations in Spectra Charts.
Read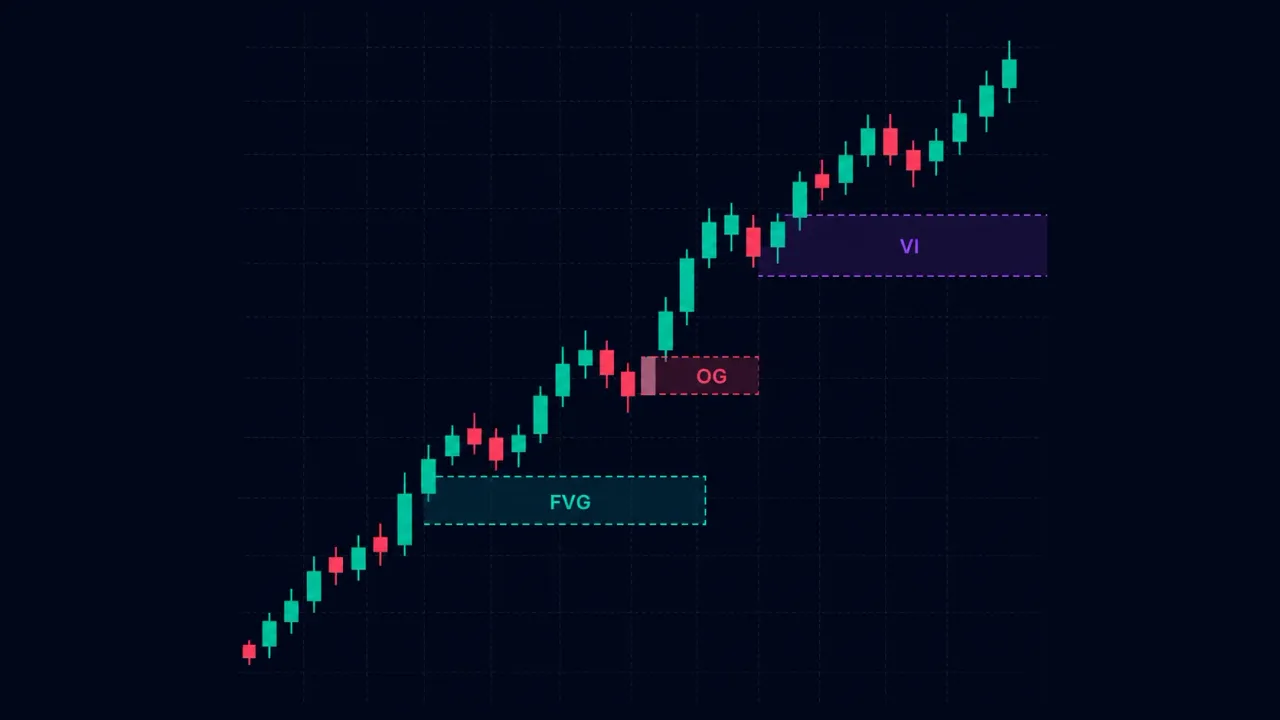
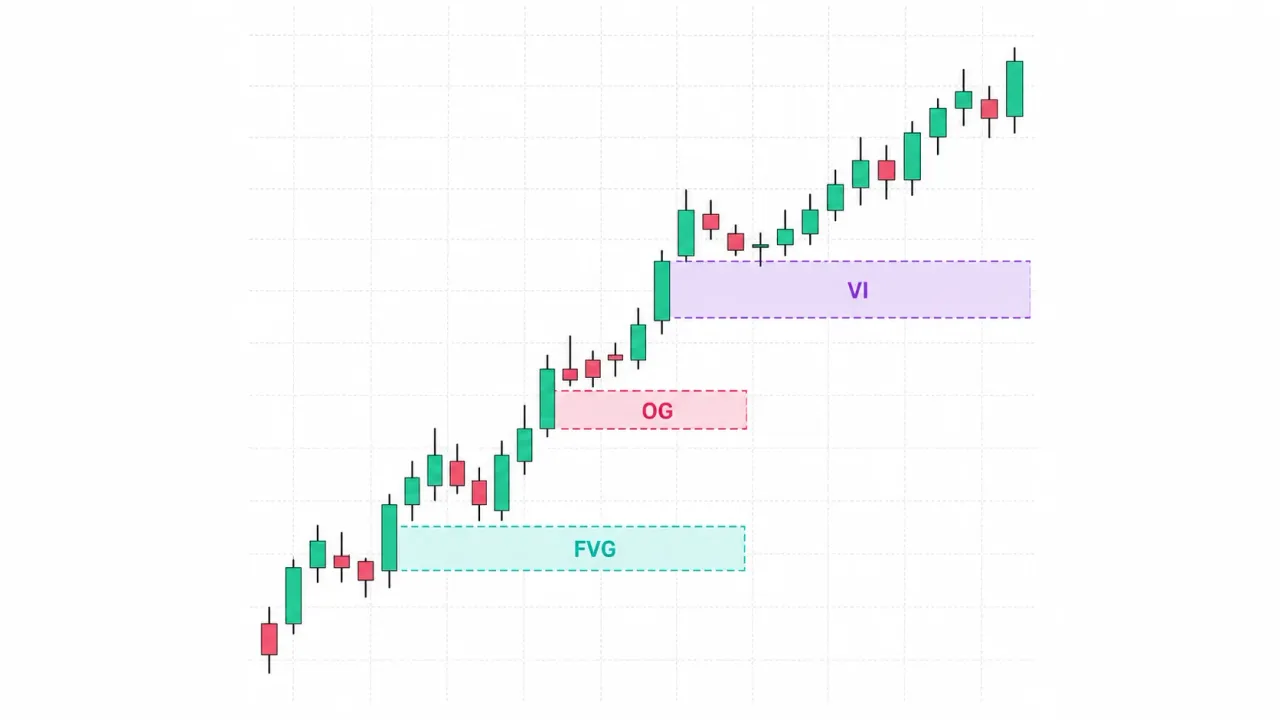
Indicator Imbalance Suite — FVG, OG, and VI
Price imbalance zones: Fair Value Gap, inter-candle gaps, and void imbalances. How zones are constructed, which filters are applied, how to control width via Points/%/ATR, parameter recommendations, and a working plan.
Read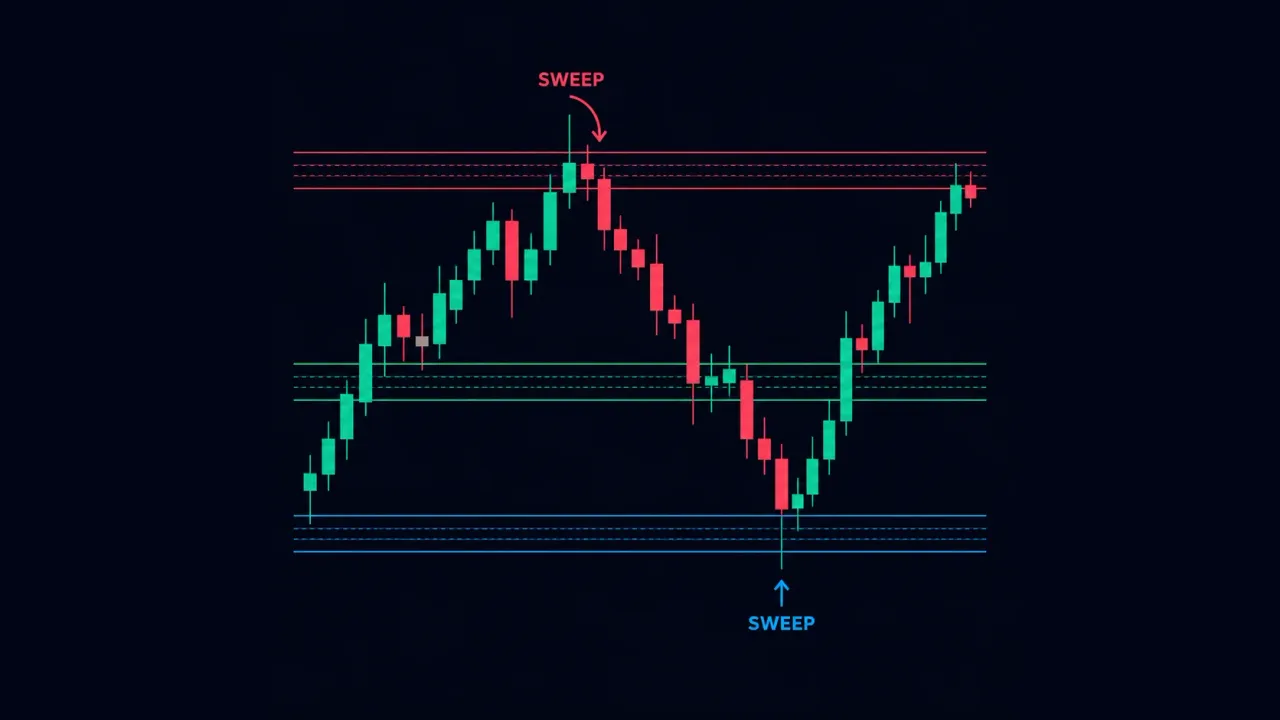
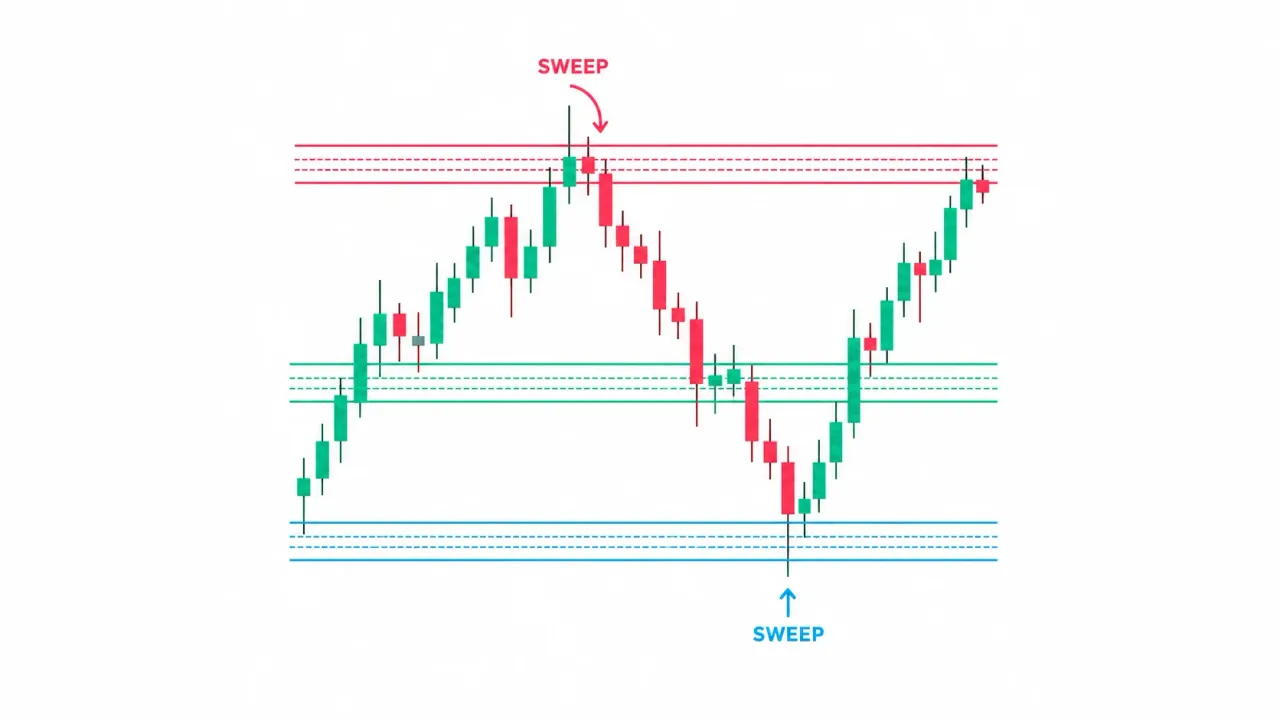
Indicator Liquidity Sweep — sweeps from clustered levels
Clusters of swing levels, live support/resistance lines, SWEEP markers on price overshoot and return. Tolerance settings via ATR or %, presets for OTC and the real market, working plan.
Read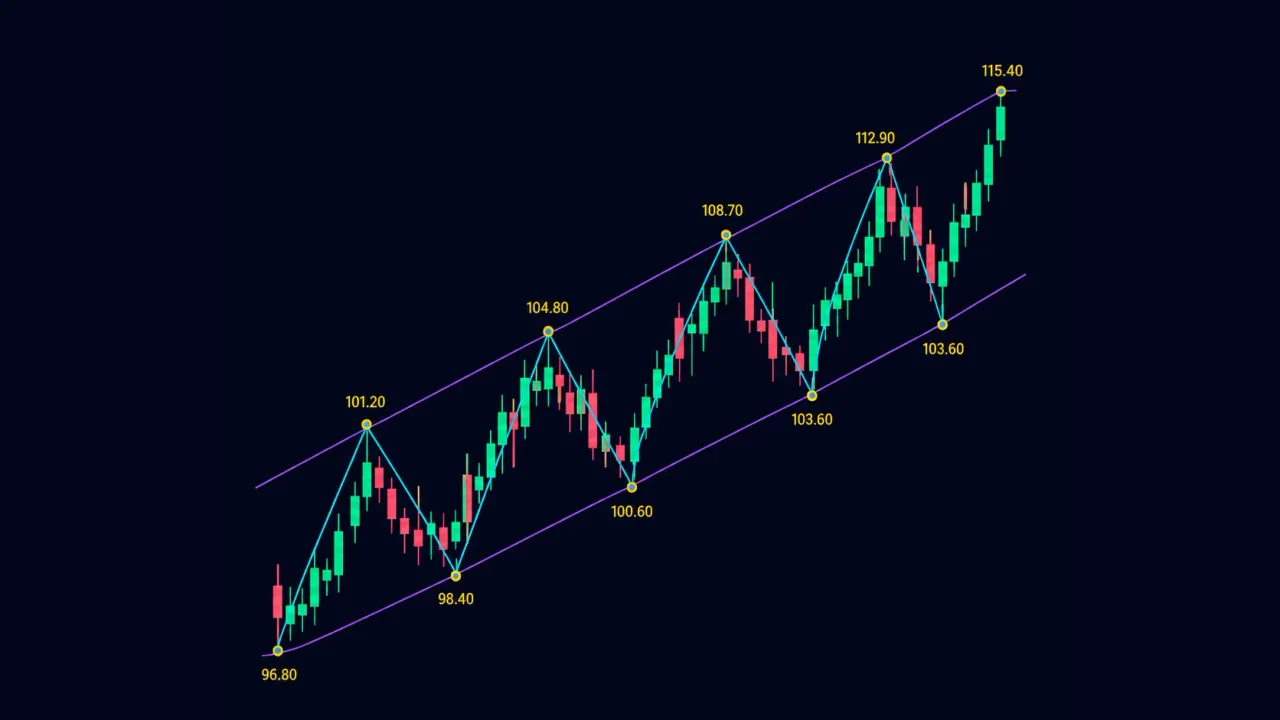
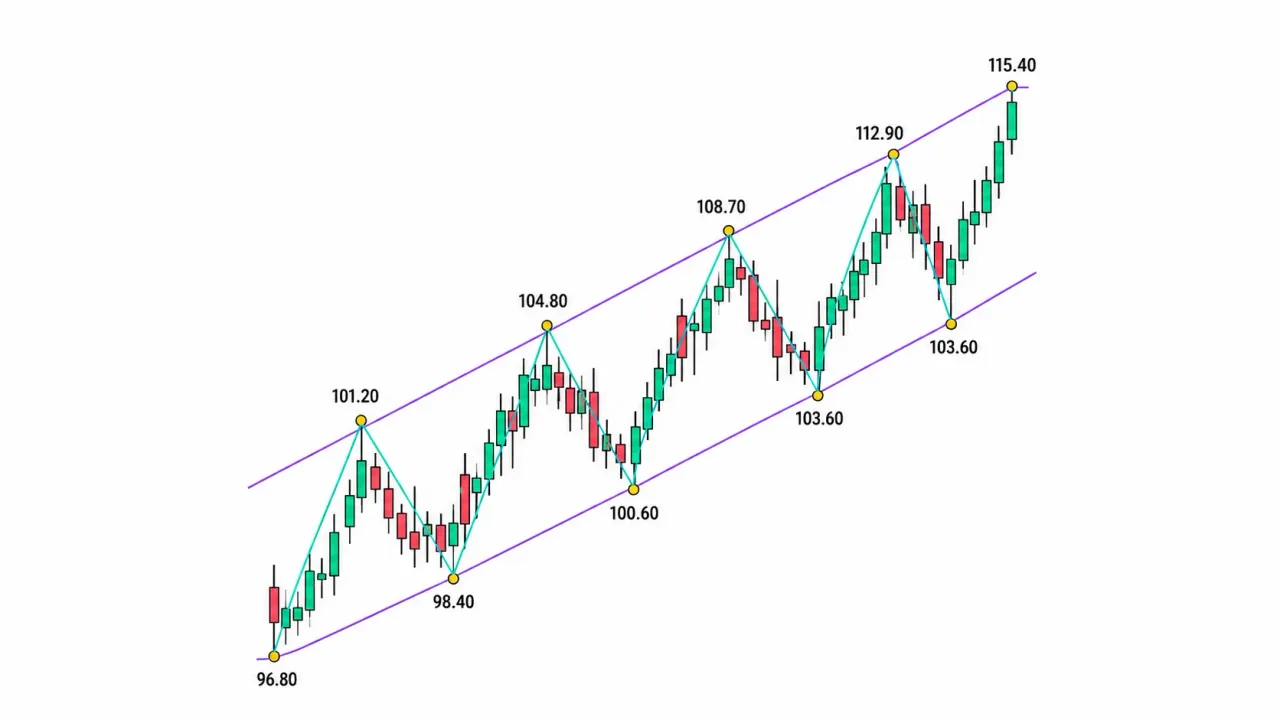
Indicator ZigZag Channels — dynamic channels from extremes
ZigZag based on confirmed extremes, automatic channel boundaries and price labels. How the markup is built, which parameters affect visibility and clarity, presets for OTC and the real market, and a working entry plan.
Read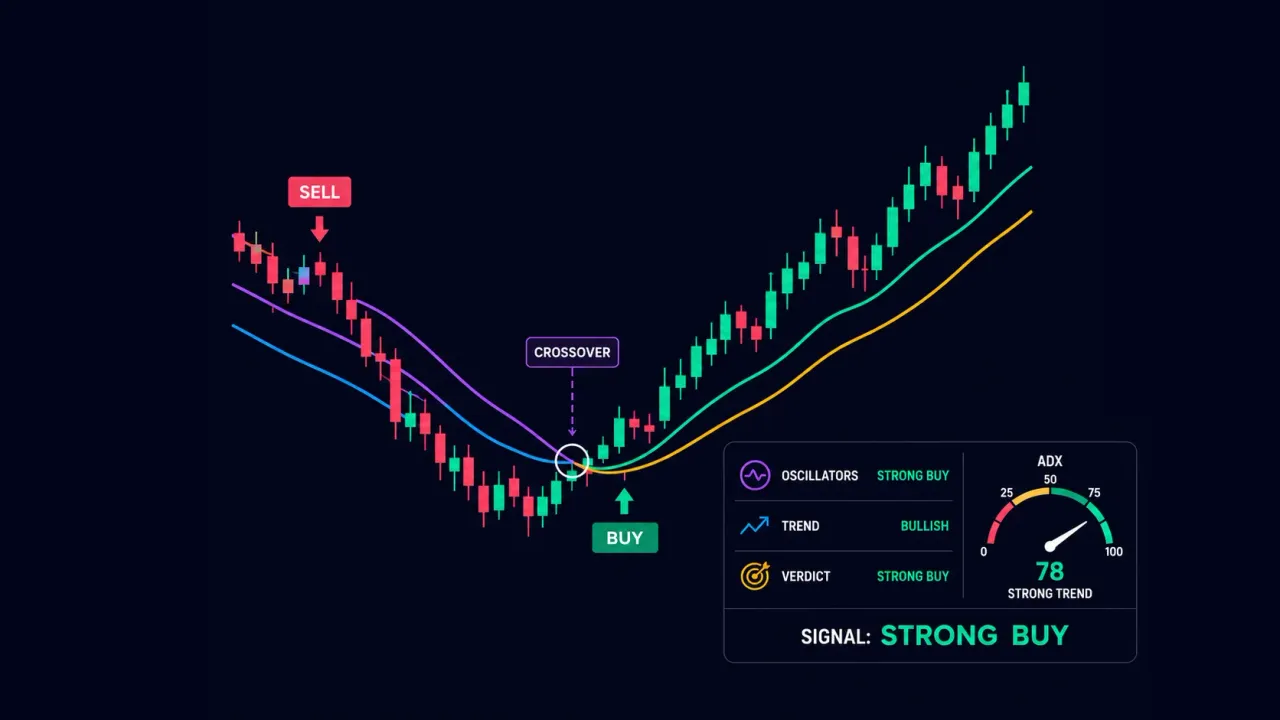
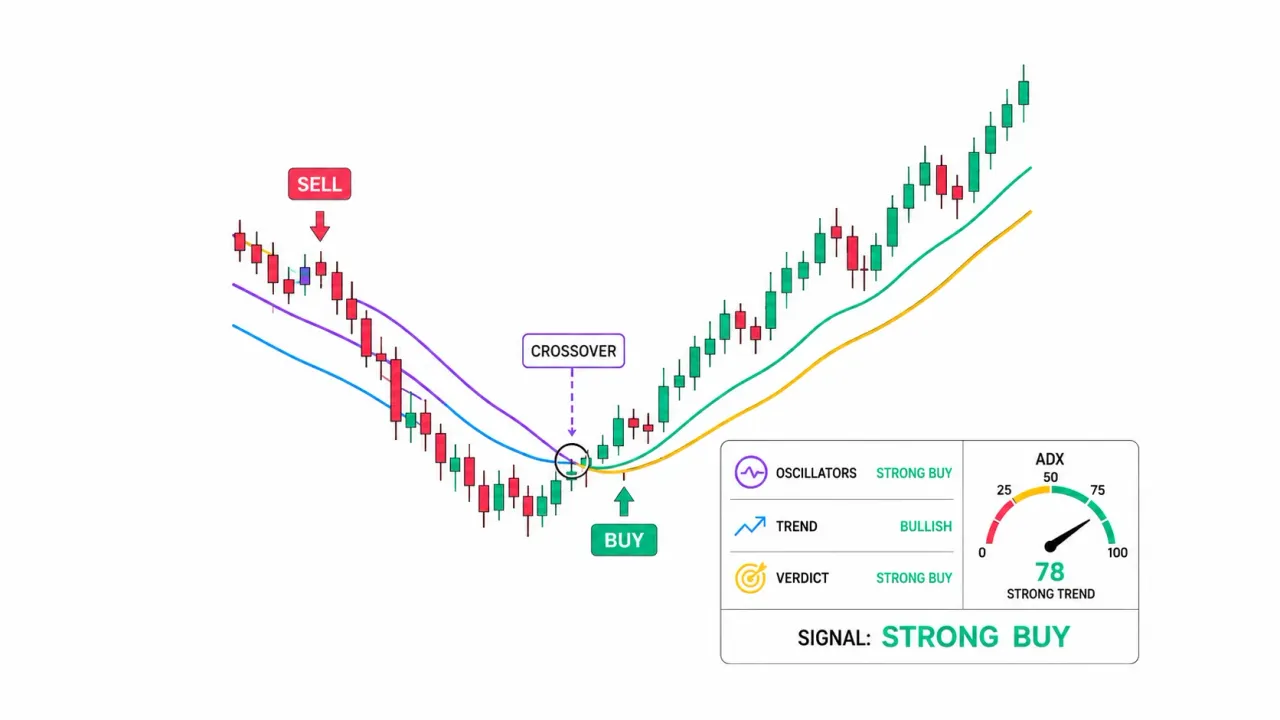
Indicator Summary Analytics HUD — overall market assessment card
On-chart card: oscillators, trend, and a final verdict factoring in ADX, a neutral band, and hysteresis. TF 10s–10m presets, fine sensitivity tuning for Pocket Option in Spectra Charts.
Read
Indicator Order Blocks — automatic supply and demand zones
Clear search for the source candle after BOS, building zones by body, wick, or from the open, extending until mitigation or invalidation, merging nearby areas. Ready-made presets for Pocket Option in Spectra Charts.
Read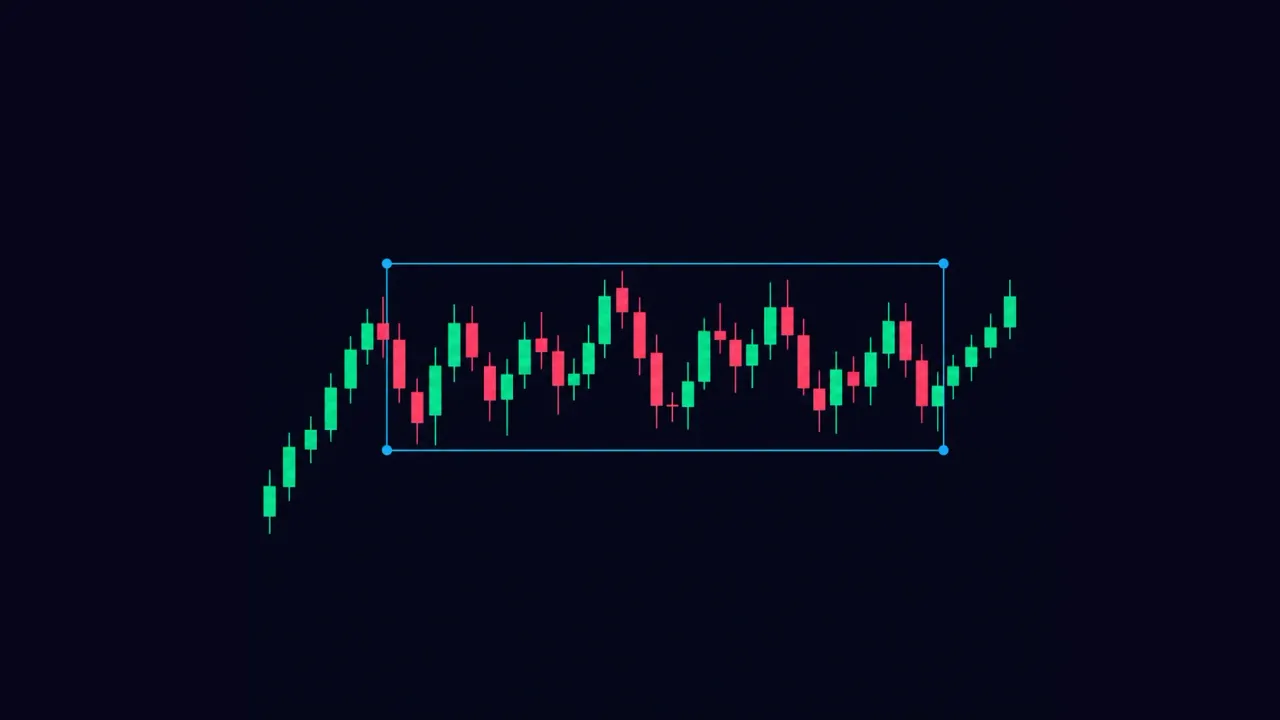
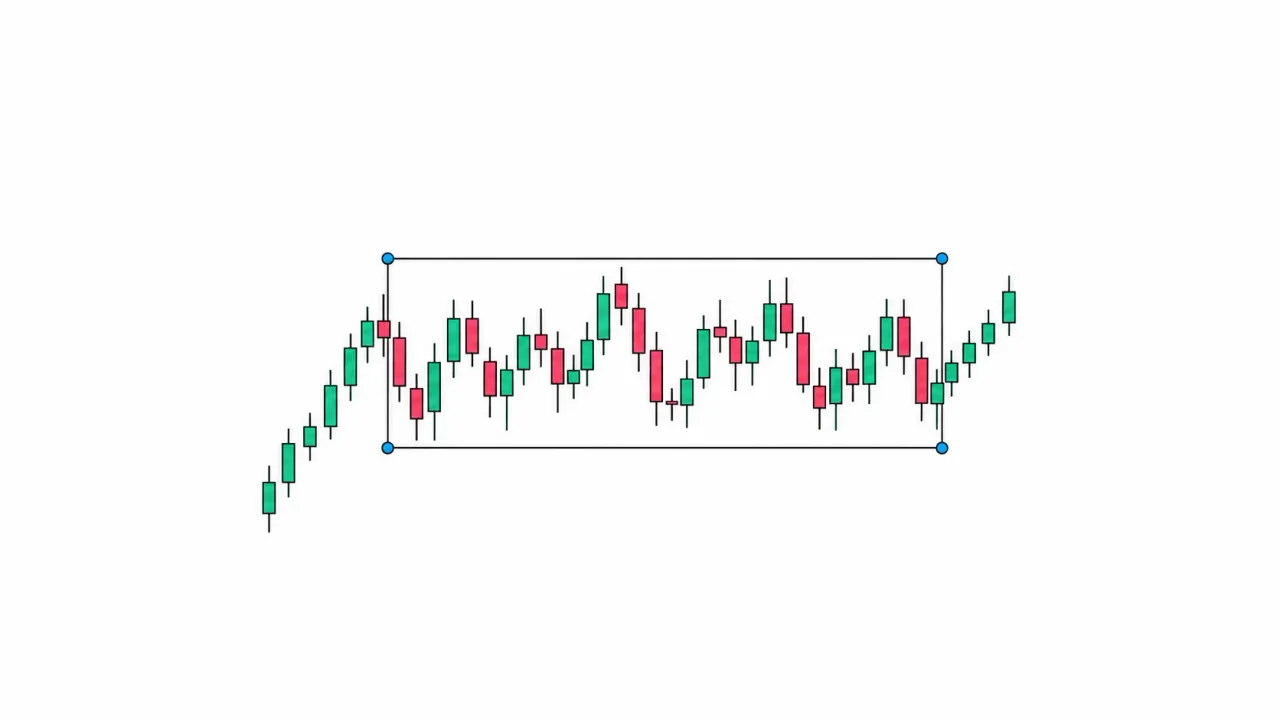
Indicator Range Detector — one-click range and breakout detection
Automatically finds price ranges around the SMA with ATR-based width, extends zones, labels upside/downside breakouts, and marks broken zones in gray. Ready-made presets for Pocket Option in Spectra Charts.
Read